Merch on YouTube pays roughly $500 to $1,500 a month for a channel near 5,000 subscribers, $5,000 to $15,000 near 50,000, and $50,000 to $200,000 or more once a channel passes 500,000. Those are gross-sales scenarios from published planning bands, not a rate per subscriber and not money anyone keeps.
The distance between the top and bottom of every band is the story. Say a creator books $40,000 of gross merch sales across a year. After blanks, printing, platform fees, shipping, returns and the shirts that never found a buyer, the amount that reaches their bank account can be a quarter of that or less. Analysts quote the top line because it's easy to count. The creator lives on the bottom line.
That gap is what separates a real merch business from a nice-looking screenshot. Every figure below gets pushed through three filters: what it costs to produce, who absorbs the risk of unsold stock, and whether the same fan would have paid through AdSense or an affiliate link instead.
Table of Contents
- Merch Earnings by Subscriber Band
- Where Merch Sits in Creator Income
- What a Thirty Dollar Shirt Actually Keeps
- Merch Compared with AdSense
- Owned Merch Versus Affiliate Links
- How to Estimate Your Own Merch Income
- Test One Product Before You Scale
Merch Earnings by Subscriber Band
Published planning ranges put gross monthly merch sales at $500 to $1,500 for a channel around 5,000 subscribers, $5,000 to $15,000 around 50,000, and $50,000 to $200,000 or more once a channel passes 500,000, according to a custom apparel guide to YouTube merch. The word "indicative" carries the weight in that sentence. These are estimate ranges, not measurements of what any specific channel banks.
| Subscriber band | Indicative monthly merch sales | What this is not |
|---|---|---|
| About 5,000 subscribers | $500-$1,500 | Not a guaranteed rate |
| About 50,000 subscribers | $5,000-$15,000 | Not take-home profit |
| 500,000 subscribers or more | $50,000-$200,000 or more | Not pay per subscriber |
Nothing in those bands scales automatically with audience size. The same guide notes that individual merch earnings can run from hundreds of dollars a month to millions a year precisely because subscriber count alone doesn't determine sales.
The Math Behind a Single Video
A video with 50,000 views and a 0.3% merchandise conversion rate produces 150 purchases. At a $25 average order value that's $3,750 in gross sales, and at a 30% profit margin it leaves about $1,125 before broader operating costs. Those four numbers sit inside the same source and they tell you more than any subscriber row does.
The conversion rate is where most forecasts fall apart. Move 0.3% to 1% and the same video triples its order count. Move it to 0.1% and you've sold 50 shirts, which barely covers the effort of building a store. Nobody publishes a reliable conversion benchmark, because conversion depends on how badly the audience wanted the object in the first place.
Planning rule: Write your band number down as gross sales, then write a second number for what you keep. If the second number embarrasses you, the product isn't ready.
Why a Small Channel Beats a Big One
A loyal niche can outsell a larger cold audience. A channel of 8,000 people who share inside jokes will buy a shirt that references one of them. A channel of 400,000 passive viewers may never see the pinned comment. Merch income tracks product relevance, fan loyalty, launch frequency, pricing, audience geography, and whether the creator holds inventory or produces on demand.
Geography deserves its own line. A drop that sells well in one country can stall in another where shipping costs as much as the garment, or where the fan needs a size chart in a different sizing convention.
Pick the row closest to your channel, treat it as a gross-sales scenario, and stop there for now. Turning that scenario into income you can keep takes the rest of the work.
Where Merch Sits in Creator Income
Merch is one line in a five-line income statement, not a salary. A 2024 market estimate placed merchandise at 11.4% of creator revenue, compared with 22.7% for brand collaborations, 22.1% for advertising, 20.0% for subscriptions and 12.5% for affiliate marketing, per creator-economy market statistics. Merchandise has become a durable category beside ads and sponsorships rather than an occasional promotional stunt.
| Income type | Share of creator revenue | Implied amount on $100,000 |
|---|---|---|
| Brand collaborations | 22.7% | $22,700 |
| Advertising | 22.1% | $22,100 |
| Subscriptions | 20.0% | $20,000 |
| Affiliate marketing | 12.5% | $12,500 |
| Merchandise | 11.4% | $11,400 |
Here's how that pie looks when you put a number on each slice.
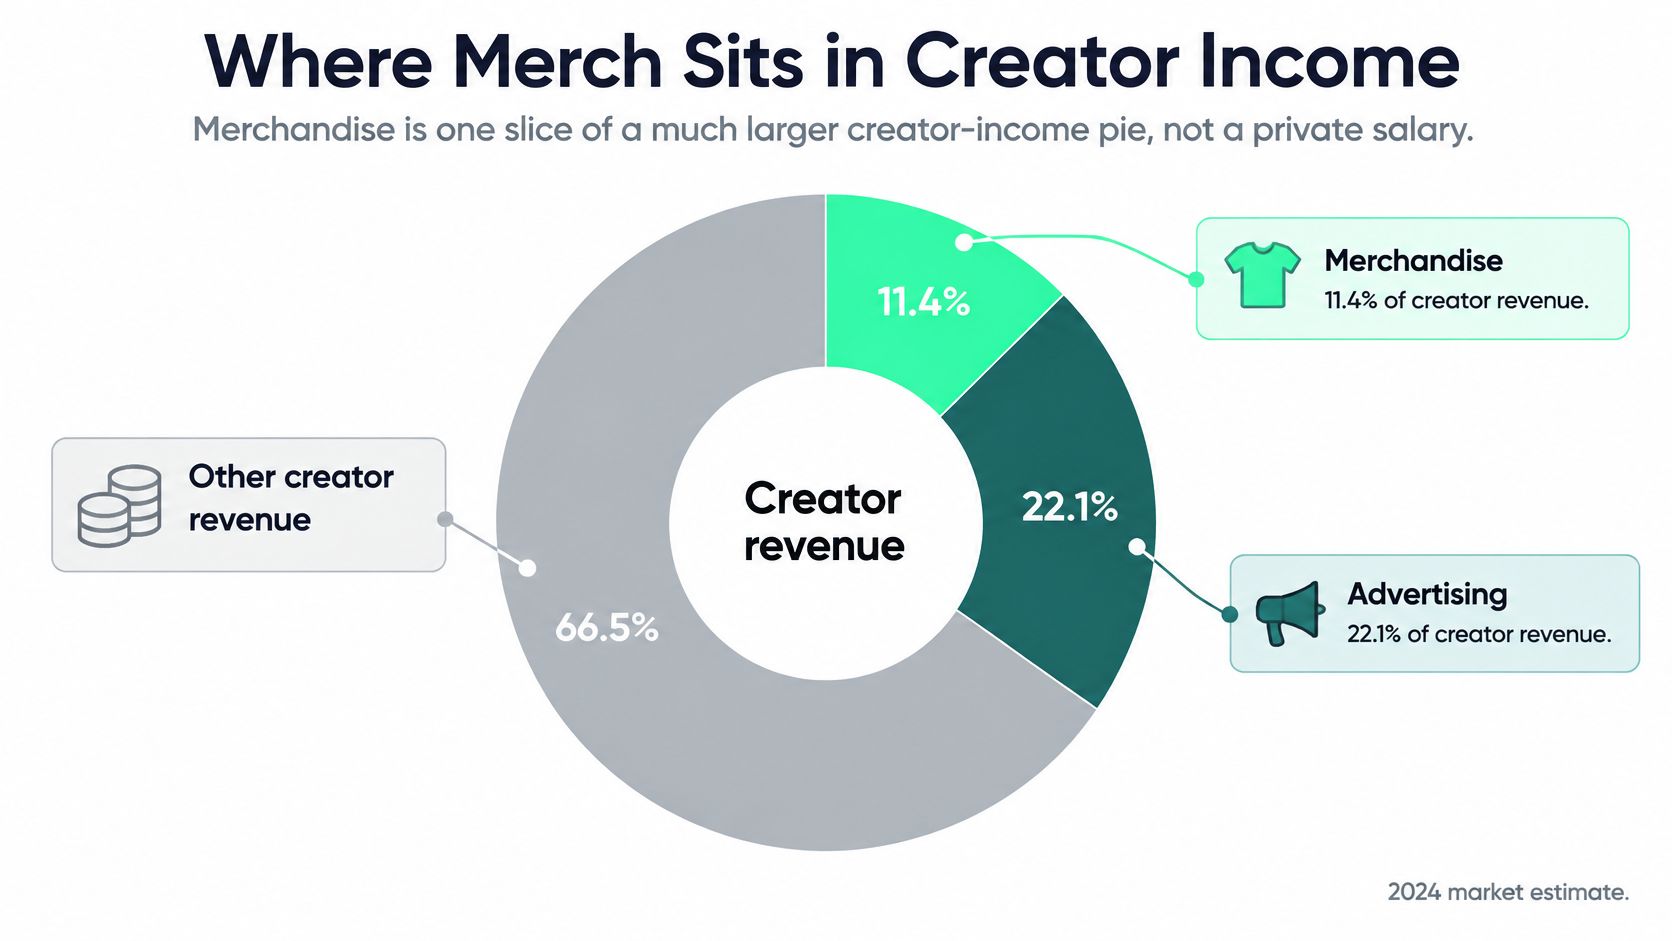
The percentage becomes money when you scale it. A channel generating $100,000 in annual creator revenue would see roughly $11,400 of merchandise-related revenue at the benchmark. The same benchmark implies about $114,000 for a creator business producing $1 million a year.
What 11.4 Percent Actually Describes
It describes an ecosystem average that combines creators of different sizes, niches and business models. It isn't a quota assigned to your channel, and a channel that earns 4% from merch isn't failing. Plenty of successful education and finance channels barely sell objects at all.
It's also gross revenue contribution, not profit. A YouTuber selling a $30 shirt may retain substantially less after blank garments, printing, shipping, payment processing, customer support and unsold inventory. The same benchmark that says "$11,400" says nothing about what lands in your account after those deductions.
Practical rule: Use 11.4 percent to sanity-check your expectations against the wider market, then throw it away and model your own numbers.
If you want to see how the streams fit together as a system rather than five isolated percentages, this breakdown of YouTube creator monetization maps the whole stack. Then replace the benchmark with your own conversion rate, average order value, repeat purchase rate and contribution margin. That substitution is the entire job.
What a Thirty Dollar Shirt Actually Keeps
A $30 shirt does not put $30 in a creator's pocket. Gross sales measure what customers pay; contribution margin measures what remains after the costs tied to each order. The 2026 creator economy report discusses creator income, but a broad revenue figure cannot replace a product-level profit model.
The order of deductions matters because each one reduces the amount available to cover the next costs of running the business.
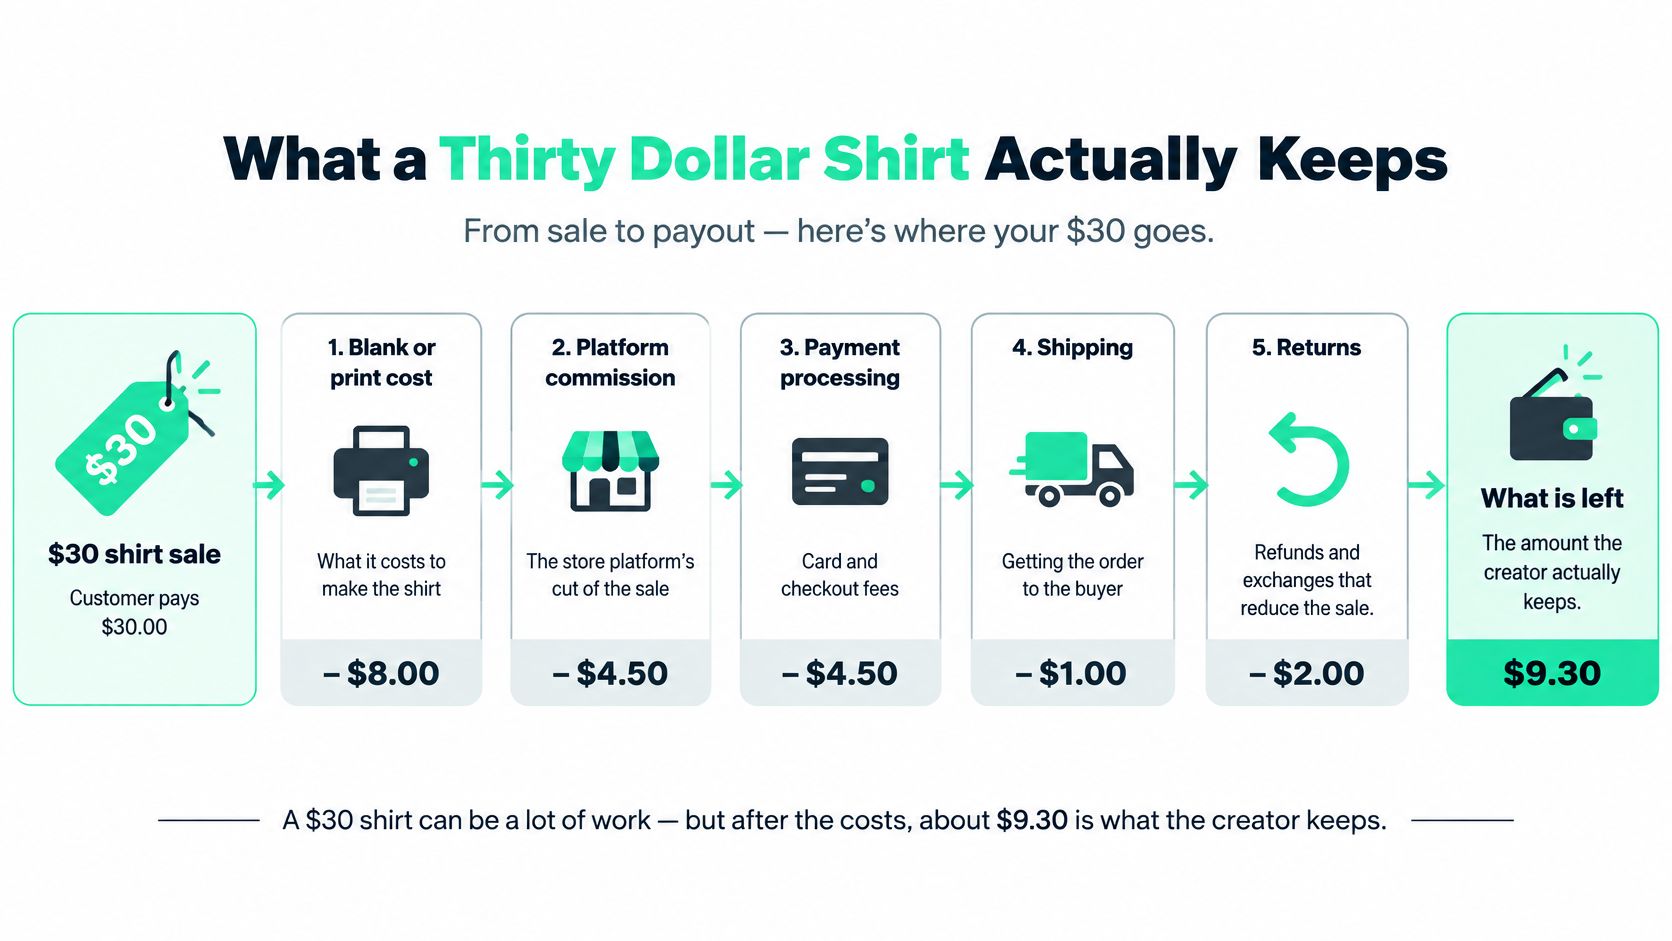
The Deductions Arrive in a Fixed Order
- Blank or print cost. The garment and its decoration cost money before the sale produces any margin.
- Platform commission. A store or marketplace may take a share of the sale, not just the profit.
- Payment processing. Card fees apply to the transaction even when its margin is thin.
- Shipping. The creator either builds the cost into the price or accepts a smaller contribution.
- Returns and refunds. A returned shirt can leave the seller with outbound shipping costs and, in some cases, the garment cost.
- Discounts and sales tax or VAT. A discount can erase the margin left after production and fulfillment.
- Unsold inventory. This risk applies when stock is purchased ahead of demand.
Use contribution margin to compare prices on equal terms. At a 30% contribution margin, a $25 order leaves about $7.50, while a $30 order leaves about $9. That remainder still has to cover design time, promotion and customer service. The margin framework in this merchandise business model guide helps distinguish money collected from money available to pay for the work behind a sale.
Three Fulfillment Models, Three Risk Profiles
A shirt's shelf price alone cannot show what the creator keeps. Fulfillment choices shift costs, operational work and the risk of unsold stock.
| Cost line | Buy inventory up front | Print on demand | Managed zero-inventory |
|---|---|---|---|
| Cash before the first sale | Highest, blanks and printing paid up front | None | None |
| Cost per unit | Lowest per unit at volume | Higher per unit, no volume discount | Set by the platform fee stack |
| Shipping to the fan | Creator prices and arranges it | Often bundled into the product price | Handled by the provider |
| Returns and support | Creator absorbs every ticket | Split by contract with the printer | Provider handles it |
| Unsold stock | Full risk on the creator | None | None |
| Delivery speed | Fast when stock is on hand | Slower, made to order | Slower, made to order |
| Effect on contribution per order | Widest margin and widest loss if the drop misses | Thinner but predictable | Thinner after fees, lowest operational risk |
Buying inventory can increase margin per unit, but it also puts the unsold-stock risk on the creator. Print on demand and managed zero-inventory models reduce that exposure while leaving less contribution after costs. The choice depends on how much risk and fulfillment work the creator can absorb, not on which model sounds simplest.
The International Leaks Nobody Models
Cross-border orders can add VAT or GST, duties, currency conversion and return logistics to the cost stack. These expenses can change contribution even when the shirt's retail price stays the same. A domestic estimate of $9 per order therefore does not guarantee the same result for an international delivery, particularly if customs charges lead to a refused package.
Payout figures also have limits. Published creator-income estimates offer direction rather than a precise prediction for an individual channel, since platforms do not disclose granular individual payouts.
The practical comparison is contribution margin, break-even order count and refund rate, not gross merchandise volume alone. A creator with fewer sales can keep more per order and carry less operating risk than a larger seller whose launch numbers look stronger.
Merch Compared with AdSense
These two income streams pay for different things, and they fail for different reasons. Put them side by side on the same audience.
| Question | AdSense | Own merch |
|---|---|---|
| What triggers payment | Views and advertiser demand | A fan checkout |
| How steady it is | Closer to automatic each month | Spiky around launches and tags |
| Work after you publish | Low if you stay eligible | Design, offers, service, and returns |
| Who it fits | Broad or low-intent audiences | Loyal fans who want the object |
| What you can change | Little control over price per view | Price, product, and margin |
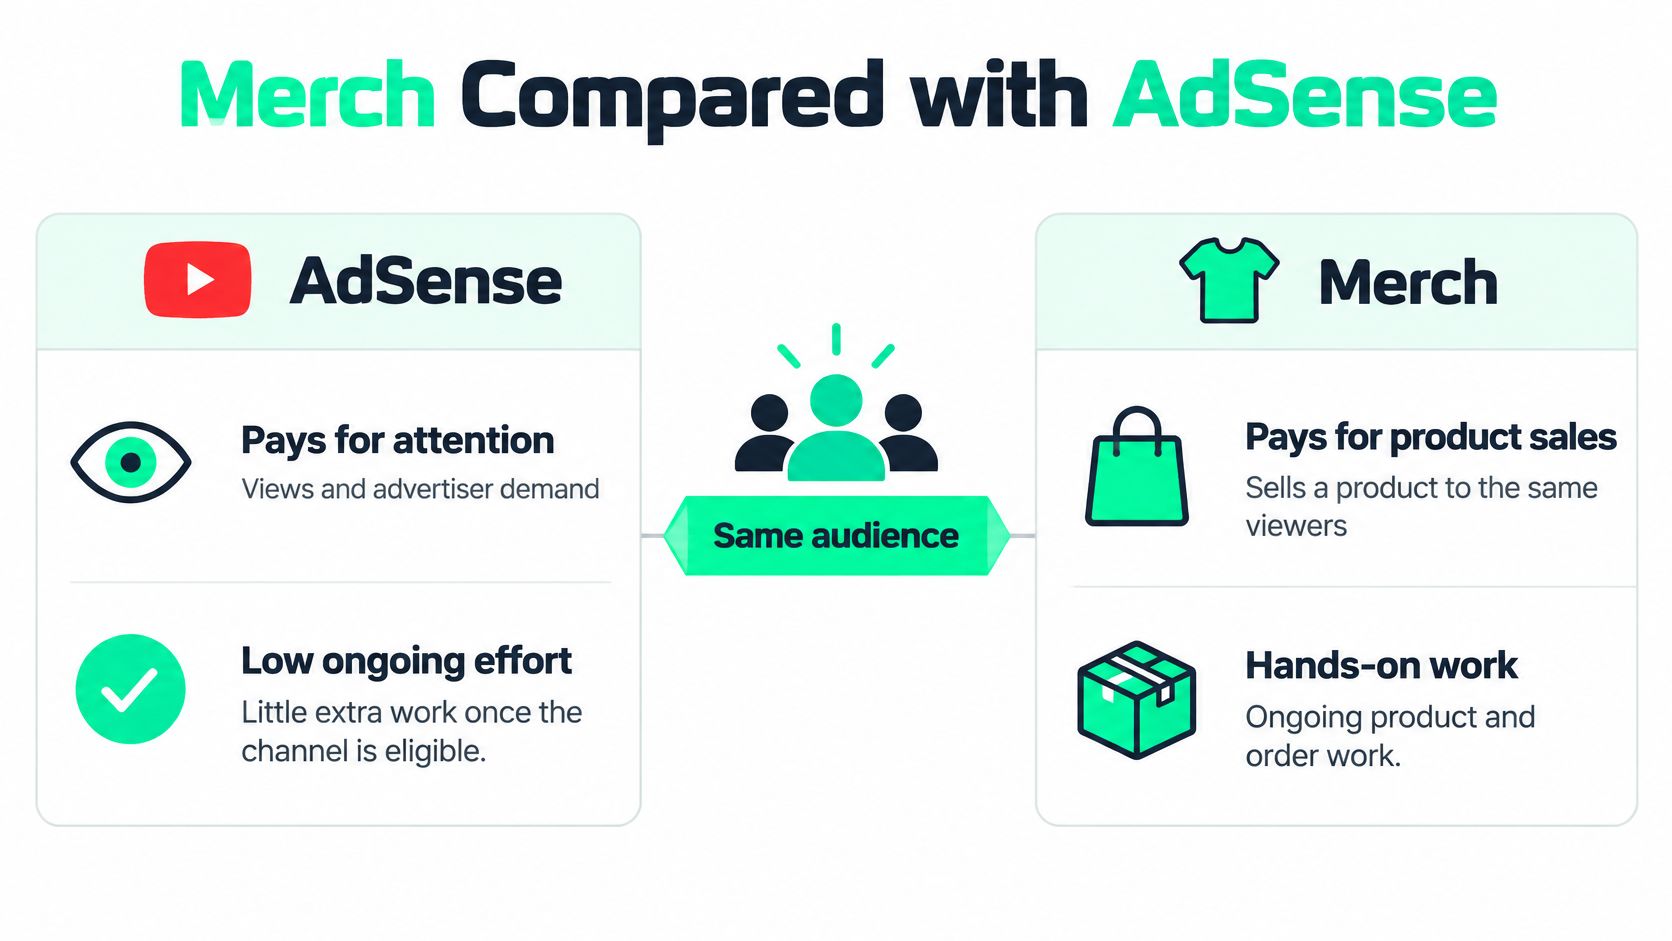
The Trade in Plain Terms
Ads pay for attention. Once a channel is eligible, the work is mostly already done: you published the video, the advertiser bought the impression, and the revenue arrives without a customer asking where their order is. That smoothness is why so many creators feel ad income first and merchandise second.
Merch pays for a decision. Someone has to want an object enough to enter a card number. A launch, a pinned comment or a product tagged in a video can spike orders for four days and then go quiet for six weeks.
The asymmetry runs both ways. You can't raise the price of a view, and you can't lower the cost of a refund. Merch can carry a much higher dollar amount per fan and can repeat when someone buys a second item. Ads repeat automatically but at a rate set by advertisers and seasonality.
Verdict by audience, not by category: a broad, low-intent audience monetizes better through ads, because the viewer never wanted a shirt. A loyal audience that quotes the channel, wears the aesthetic or asks in comments where the hoodie came from is the merch case.
Keep ads as the baseline. Add merch when you can name a product your fans would wear without a discount code. Don't drop ads because a single drop sold out, since that drop may have borrowed every purchase from the next six months.
Owned Merch Versus Affiliate Links
YouTube Shopping's growth highlights two distinct ways creators can earn from products. Reporting described 1.3 million enrolled creators and 13-fold gross merchandise value growth over two years, while noting the figures did not clearly separate affiliate products from creators' own merchandise. The figures are reported in reporting on YouTube Shopping's growth. Platform GMV signals activity, not what an individual creator keeps after costs.
Two Business Models Wearing the Same Badge
Affiliate commerce lets creators recommend someone else's products without designing or fulfilling them. The creator earns a commission when attributed sales occur, but does not control the product, pricing, customer relationship or commission terms. It can be a lower-effort fit when viewers want recommendations more than channel-branded goods.
Owned merch requires a product fans want, plus decisions about pricing, production and customer support. In return, the creator keeps more control over the offer and can build a brand asset beyond the video. Gross sales alone do not show whether that control produces stronger profit: product costs, fulfillment and returns reduce the amount retained.
The right model depends on the audience and the content. A finance channel reviewing spreadsheets may have little reason to sell a hoodie; a fitness channel may have a clearer connection between its subject and a physical product. Affiliate links can still make sense where viewers are seeking product advice, while owned merch needs a distinct reason for fans to buy.
Repeat purchasing matters to both models, but the mechanism differs. An affiliate commission depends on another attributed purchase; owned merch can bring buyers back for a new release or product. Resources such as keeping football shirt collectors coming back focus on repeat buying, though a creator still needs to assess whether that pattern fits their own audience.
Compare net earnings per 1,000 views, repeat-purchase behavior, conversion by video format and the hours required per launch. Those measures reveal whether owned merch earns more after costs and effort, or whether affiliate commissions are the better use of the same audience.
How to Estimate Your Own Merch Income
Run the estimate before you design anything. The output isn't a forecast, it's a scenario you can defend to yourself in a spreadsheet.
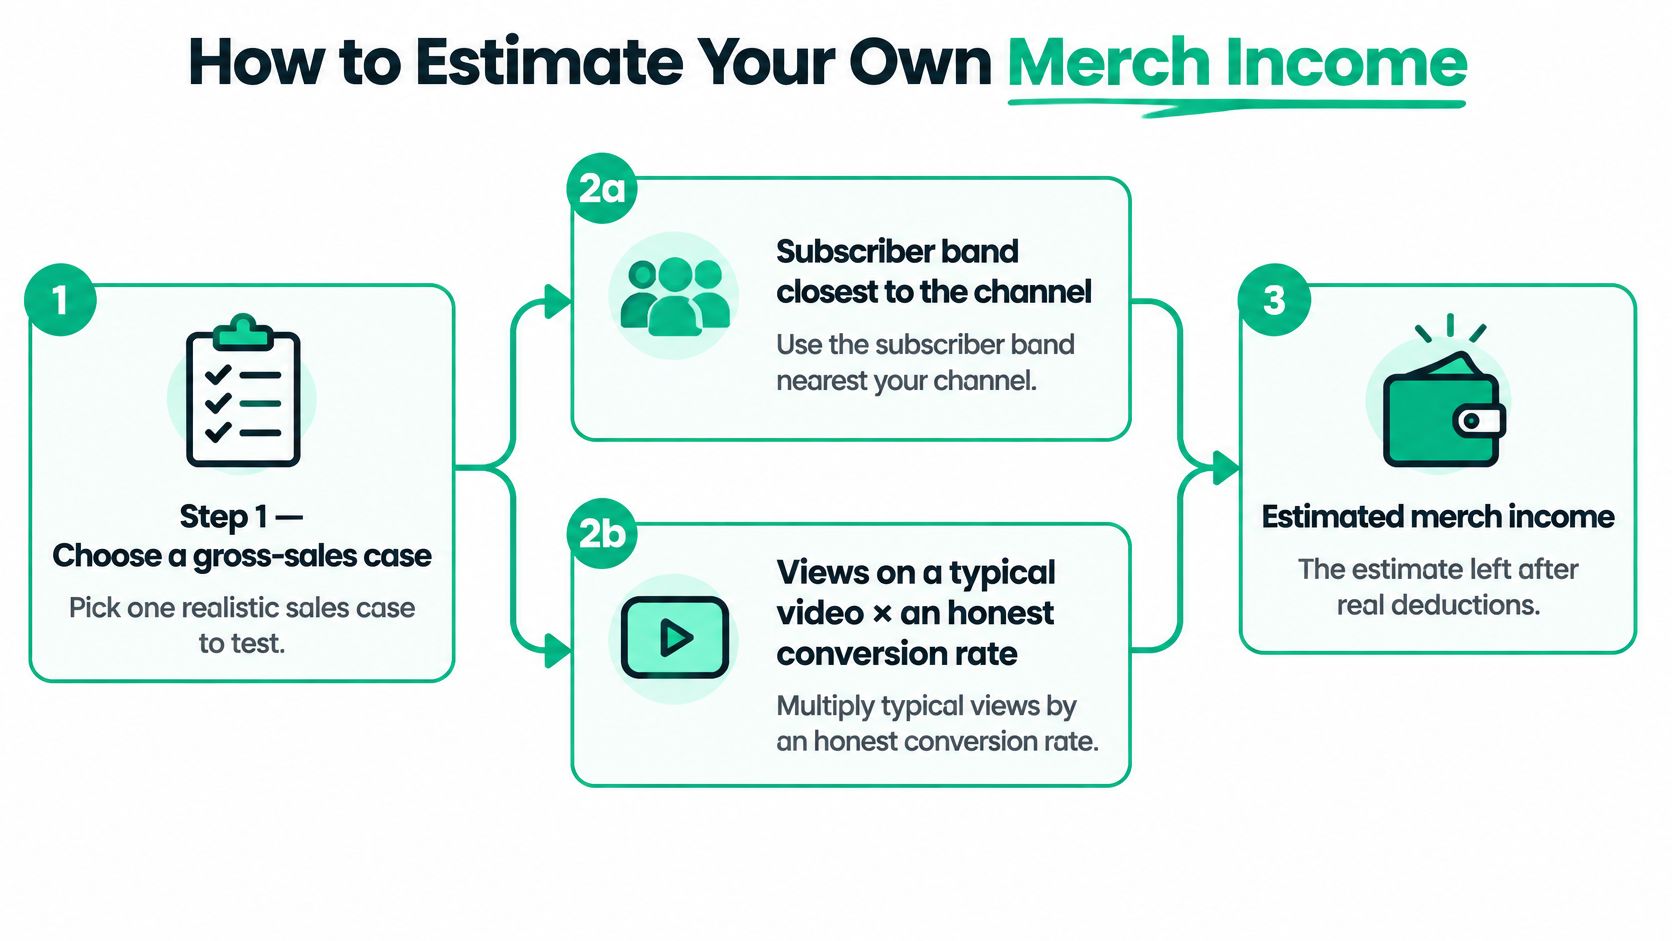
Seven Moves in Order
- Choose one gross-sales case. Either take the subscriber band nearest your channel or multiply typical views by an honest conversion rate by average order value. Write down the order count it implies.
- Run two cases, not one. A low case and a hopeful case. One fantasy rate produces one useless number.
- Subtract the cost stack for the fulfillment model you'll use, including a returns allowance and tax. Skipping the returns line is how inventory risk gets ignored.
- Divide what remains by orders to get contribution per order.
- Divide that by the video's views and multiply by 1,000 to get net per 1,000 views.
- Put AdSense from those same views beside it. Merch has to beat attention income after the work, not before it.
- Adjust for country, shipping promises and how many launches you can sustain in a year without selling the same hoodie to the same 200 people four times.
Then name the single input that moves the result most. In most models it's conversion rate or contribution margin, and it's rarely the one people spend weeks optimizing.
Decision rule: if the low case still covers costs and a few hours of your time, run the test. If it only works at a conversion rate you've never seen, stay with ads and affiliates until the audience asks for something specific.
Test One Product Before You Scale
A positive contribution per order under the low case, plus a product fans already describe in comments, is enough to justify one controlled test. It is not enough to justify a warehouse bet, a twenty-item catalog or a second mortgage on blanks.
The failure mode is volume. A creator opens with fifteen designs, buys stock in three of them, and discovers in week two that the audience wanted one specific joke on one specific garment. Unsold stock turns a learning experience into an expensive one, and the operational load arrives before the demand is proven.
Zero-inventory production removes that risk entirely. FLYP runs a program for selling merch on YouTube, with an AI Merch Generator, a Fashion Design App and a YouTube Shopping option so approved products can be tagged directly in the video and fans never have to hunt for a separate store. We build the collection and the store, then handle production, delivery and support once designs are approved.
The practical sequence is one product, one video, one pinned comment, and the low-case estimate as the scorecard. You can browse examples of what a single focused drop looks like in this guide to running a merch drop before committing to more than that. If the niche is equestrian or hobby-led, it also helps to see how a narrow audience responds to a specific object, such as the way buyers find a horse-print sweatshirt when the design speaks directly to their identity rather than to a general apparel shopper.
Judge the test on net per order, repeat interest and the number of support tickets. Not on how busy the launch week looked.
If you've run the low case and the product still makes sense, FLYP LTD gives you the shortest path from a design idea to a live drop: our platform generates the artwork, builds the collection and store, and manages production, delivery and returns, with native YouTube Shopping so products can be tagged where your viewers already are. You can start with a single item and see the contribution per order before you commit to a catalog. Visit FLYP LTD to see how the merch program works.